
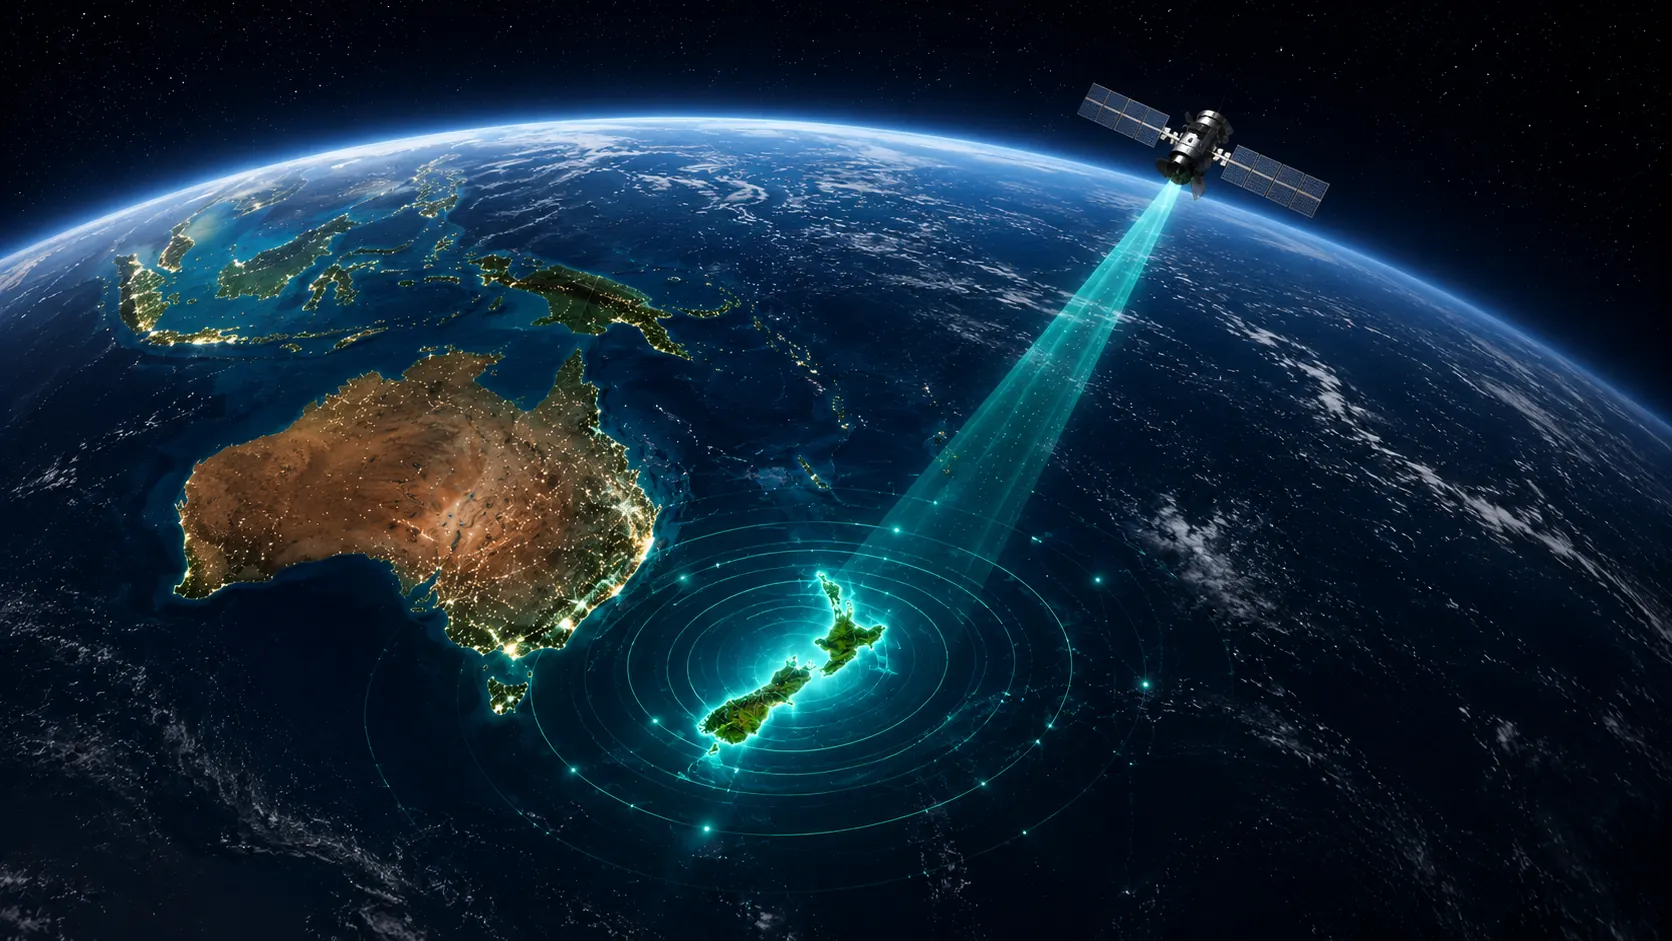
Global Satellite Intelligence Network
How we measure your land
From Space.
This page explains how LandSure tech work, what the technology can and can’t tell you, and how to read your results. What’s useful to know before you visit our Shop.
How LandSure creates clarity from complexity
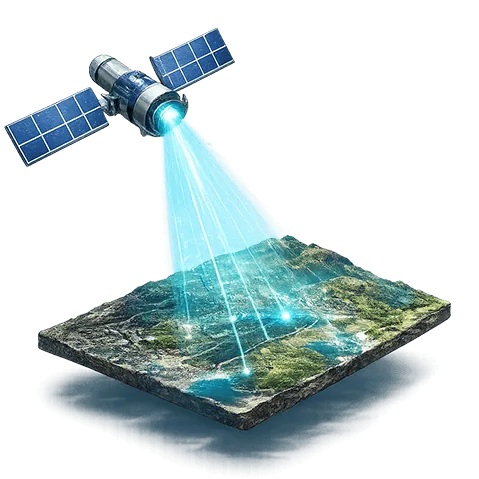
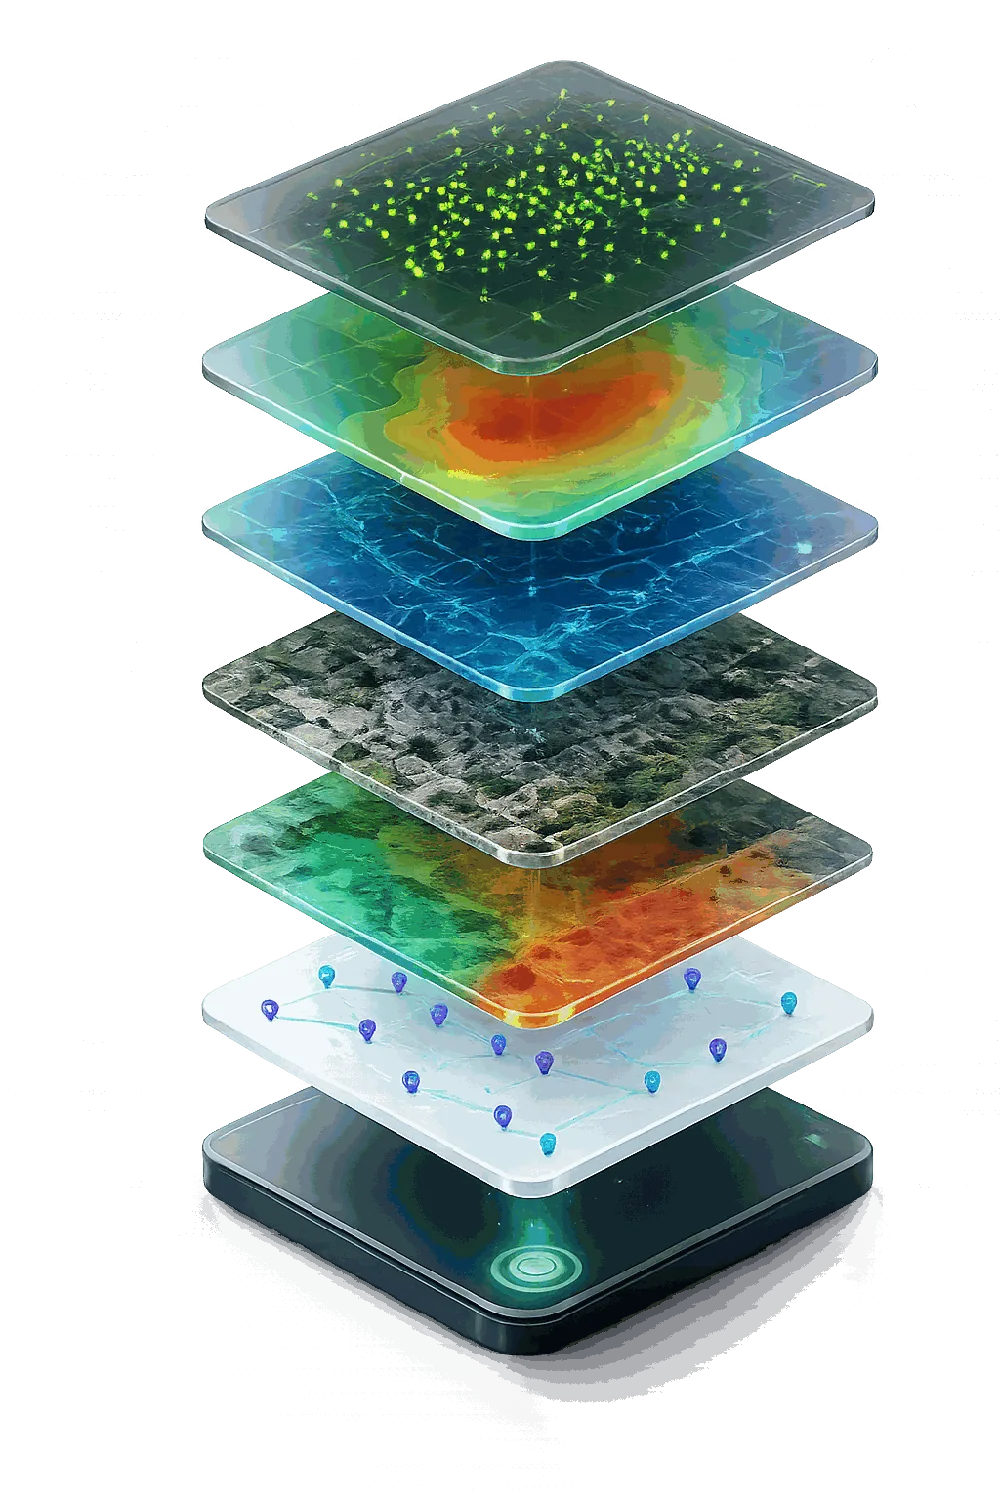
Satellites scan the Earth
Advanced InSAR satellites capture millimetre-level movement.
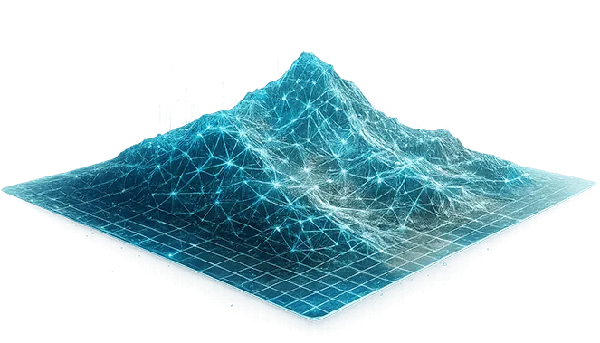
3D layer created
We measure ground movement across time with extreme precision.

Pattern change detected
Our AI models identify trends, risk zones and potential impacts.
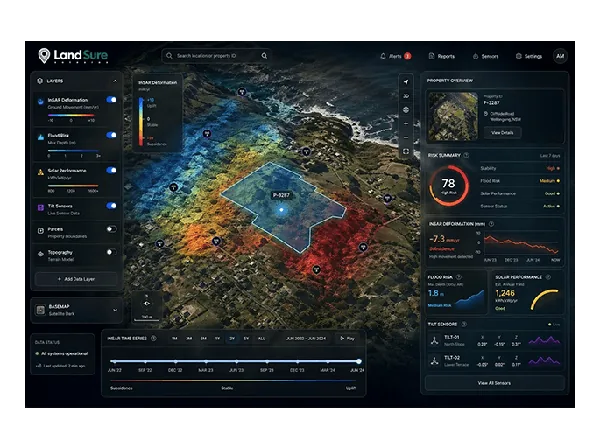
Digital twin updated
Your property's digital twin is updated every 12 days.
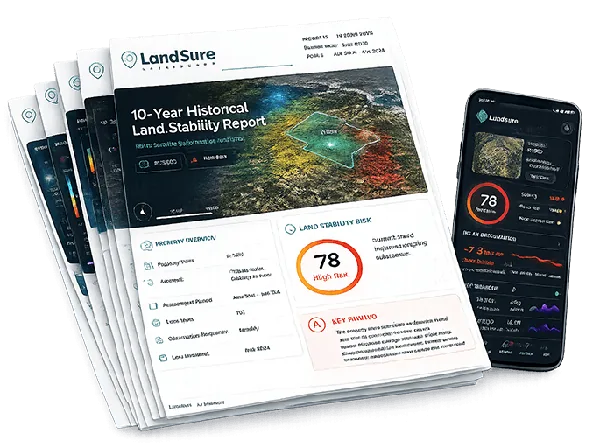
Alerts & reports delivered
Receive alerts instantly and professional reports every 12 days.
BEST USES AND LIMITATIONS OF INSAR TECHNOLOGY
Where LandSure works best
Satellite radar is incredibly good at measuring some surfaces, and less reliable on others. Here’s a simple guide to help you understand where LandSure delivers the most confidence.
| Surface or Situation | What Happens Technically | Suitability | What It Means For You |
|---|---|---|---|
Buildings, roofs and paved urban surfaces | Dense, stable radar reflectors. Strongest and most numerous monitoring points form here. | ✓✓EXCELLENT | Ideal for tracking subsidence, settlement and long-term movements. |
Roads, rail, dams and hard infrastructure | Continuous engineered surfaces hold a coherent echo for years. | ✓✓EXCELLENT | Very reliable for long-term monitoring. |
Slow trends: subsidence, settlement, creep | Millimetres-per-year movement is what a decade-deep archive is built to measure. | ✓✓EXCELLENT | Purpose-built for slow, cumulative movement. |
Exposed rock, cliffs and quarry faces | Bare rock reflects consistently. Points are reliable but sparser. | ✓GOOD | Good results where points exist; may be sparser in remote areas. |
Rural properties with buildings and yards | Points form on the house, sheds and yards. Paddocks between stay unmeasured. | !USE AS A GUIDE | Useful for monitoring buildings and nearby infrastructure. |
Steep slopes facing away from the radar | Side-looking geometry can distort or shadow a slope, thinning or biasing its points. | !USE AS A GUIDE | Interpret with care; geometry can affect accuracy. |
Sudden slips and earthquakes | Recorded as a step after the event. 12-day revisit gives no forewarning. | −LESS ACCURATE | Useful for measuring what happened, not predicting when. |
Movement running north–south | Near-polar orbits see this direction poorly; rates are underestimated. | −LESS ACCURATE | Results can be biased low. |
Very fast movement (over ~1.4 cm between visits) | Phase repeats every half wavelength. Rapid movement can be under-read. | −LESS ACCURATE | Very rapid movement can be underestimated or misread. |
Pasture, crops and bare soil | Moving or changing surfaces scramble the echo. Few or no points form. | −LESS ACCURATE | Expect few points and less reliable insights. |
Bush, forest canopy and water | C-band radar cannot hold a coherent echo on moving leaves or water. | ×NOT MEASURED | No reliable measurement points. |
The Technology, In Full
Every technology, explained - plainly.
LandSure combines several different remote-sensing technologies. Each does a specific job, and each has real limits. Pick a technology below to see what it does, how it works, and exactly where it stops. Open the technical details & certifications for the full specification.
Millimetre ground movement, tracked from space.
C-band radar satellites measure how far the ground has moved between passes - down to a few millimetres - building a 10-year movement history. It is excellent on stable, built and rocky ground. Be blunt about it: over dense bush, standing water and active earthworks the signal degrades and you get data gaps.
- Sentinel-1 C-band radar, ~12-day revisit
- Millimetre-scale, line-of-sight deformation (not raw vertical)
- 10+ years of comparable historical data
- Not reliable over dense vegetation, water or disturbed ground
Where water will go - before it gets there.
Built on TAIAO.AI environmental models, our flood mapping combines rainfall, tide, wave setup, LiDAR elevation and drainage to estimate flood depth, timing and the exposed side of your property. It is probabilistic guidance based on forecasts - not a guarantee, and it does not model water getting inside a building.
- TAIAO.AI Coastal Flood model (v2.3)
- Predicts depth band, arrival window and property-side impact
- Every prediction carries a confidence rating
- Does not model indoor ingress, structural failure or blocked drains
Reading the land across the light spectrum.
Hyperspectral imaging captures dozens of narrow bands of light to reveal vegetation health, soil moisture and ground-cover change that the eye can't see. It is an optical method, so it needs clear skies - and it only describes the surface, never what is beneath it.
- Vegetation health, moisture and ground-cover indices
- Detects surface change and environmental health over time
- Complements radar by adding surface context
- Optical only - blocked by cloud; surface-level, not subsurface
Tracking the coastline as it retreats. Not yet offered in New Zealand
This is a capability we are developing, not a service we currently sell. The method compares time-series satellite imagery against elevation and tide data to measure shoreline and cliff-edge change over years, showing long-term erosion trends and where retreat is accelerating. It is a trend tool - it will not predict a single storm or an instant cliff collapse. We do not yet produce coastal erosion reports in New Zealand. If you need coastal erosion data now, contact our team and we will point you to the right source.
- Multi-year shoreline & cliff-edge change detection
- Combines optical imagery, LiDAR DEM and tide data
- Highlights accelerating retreat near property boundaries
- Long-term trend analysis, not single-event prediction
- In development - not part of any current LandSure product
The next generation of radar - NISAR.
NISAR is the NASA-ISRO dual-band (L- and S-band) radar mission. Its longer L-band wavelength penetrates vegetation far better than C-band, improving deformation measurement in exactly the bush-covered terrain where InSAR struggles today. We are integrating NISAR data as coverage becomes available - it is emerging, not yet a complete record.
- NASA-ISRO L-band + S-band SAR
- Better vegetation penetration than C-band
- ~12-day repeat with fine deformation sensitivity
- Coverage and historical depth still ramping up
Bring Your Own Data (BYOD), your way.
Designed for geotechs, developers, consultants and organisations who need the flexibility to work with their own data - combined with LandSure's satellite intelligence and IoT insights, in one platform.

Don't wait for the signs. Monitor the invisible.
Geospatial Intelligence Knowledge Hub
Frequently Asked Land Monitoring Questions
Straight answers about land movement, InSAR satellite monitoring, flood prediction and how LandSure works in New Zealand conditions.
Land subsidence is the gradual sinking or movement of the ground over time. In New Zealand, subsidence can be caused by natural geology, coastal erosion, groundwater movement, slope instability, earthworks, drainage issues or long-term soil movement.
Most subsidence begins gradually and may not be visible until cracks, settlement or structural damage appear. LandSure uses satellite-based InSAR monitoring to identify movement trends before they become obvious on the ground.
Many properties show no visible signs during the early stages of movement.
LandSure analyses satellite observations collected over time to identify subtle changes in ground behaviour. These trends may appear months or years before visible cracking, retaining wall movement or slope instability becomes obvious.
No. Small amounts of movement occur naturally across many parts of New Zealand. The important factors are:
- Movement rate
- Acceleration
- Consistency
- Location
- Surrounding geology
LandSure is designed as an early warning system to help identify changing trends that may justify professional investigation by a geotechnical engineer.
Risk depends on soil type, slope angle, geology, nearby infrastructure and movement history. A movement rate that may be insignificant in one location could be concerning in another.
This is why LandSure combines satellite observations with AI analysis and recommends geotechnical review where risk indicators increase.
InSAR (Interferometric Synthetic Aperture Radar) is a satellite monitoring technology that measures tiny changes in the surface of the Earth over time.
By comparing radar images captured from space, InSAR can detect millimetre-scale movement that would be impossible to see with the naked eye.
InSAR can detect movement at millimetre-per-year precision under suitable conditions.
According to SatSense, average velocity measurements can achieve accuracy around a millimetre per year, while individual observations are typically accurate to a few millimetres depending on the surface being measured.
Most LandSure monitoring uses Sentinel-1 radar imagery. Satellite observations are generally collected every 12 days, although some locations may receive more frequent overlapping observations depending on satellite coverage.
Yes. Radar satellites continuously measure reflected signals from the Earth surface. When those reflections are compared over time, tiny changes in elevation and ground position can be detected and measured. This technology is widely used internationally for:
- Landslides
- Rail corridors
- Infrastructure monitoring
- Mining operations
- Flood-prone areas
- Urban subsidence monitoring
Yes, but performance depends heavily on terrain and surface conditions. InSAR generally performs best where the radar signal consistently reflects from stable surfaces such as:
- Urban environments
- Exposed ground
- Rocky terrain
- Coastal cliffs
- Infrastructure corridors
- Developed land
Many New Zealand coastal and hillside communities are well suited to long-term monitoring.
Not always. Dense vegetation can reduce radar coherence, making it harder to consistently track the same ground surface over time.
This does not necessarily mean monitoring is impossible, but data quality may be reduced depending on vegetation density and terrain.
It depends. Farmland can sometimes create challenges because paddocks change frequently, cultivation alters surface geometry, grazing patterns change vegetation, and soil moisture varies significantly. Stable pasture generally performs better than frequently disturbed land.
Dense forest can reduce measurement quality because radar reflections change as vegetation moves and grows. Where significant forest cover exists, LandSure may recommend combining satellite monitoring with ground-based IoT sensors.
Yes. Coastal cliffs and exposed rocky terrain are often among the strongest environments for InSAR monitoring because stable radar reflections can be maintained over long periods.
Like any monitoring technology, InSAR has limitations. Data quality can be reduced by:
- Dense vegetation
- Recent earthworks
- Active construction
- Large landslides
- Flooding & standing water
- Rapidly changing surfaces
These conditions can interrupt radar signal consistency and create temporary data gaps.
Yes. Large sudden failures can change the surface so dramatically that radar coherence is temporarily lost. Monitoring often resumes once the area stabilises and consistent radar reflections return.
Gaps can occur when the surface changes too quickly between satellite observations. Examples include major slips, earthworks, excavation, vegetation clearance and construction activity. These changes can affect radar coherence and reduce measurement reliability.
LandSure combines terrain models, elevation data, drainage pathways, rainfall information and historical environmental datasets to model how water may accumulate across a property and surrounding landscape. Flood modelling is powered by environmental AI from TAIAO.AI.
Selected flood-risk datasets are included across LandSure plans, with advanced flood modelling available through enterprise and premium monitoring options.
Yes. LandSure can generate automated alerts when monitored conditions exceed predefined thresholds or when environmental models indicate elevated flood risk.
Tilt sensors are physical monitoring devices installed on-site by geotechnical professionals. They measure real-world ground movement and structural tilt between satellite observations.
Satellite monitoring provides broad-area visibility. Tilt sensors provide high-frequency local measurements. Together they create a stronger monitoring system that combines long-term trends, local movement validation and real-time alerts.
Yes. LandSure can generate SMS alerts, email notifications and dashboard warnings - and in high-priority deployments, integration with alarm systems may also be configured.
No. LandSure is designed to support earlier engagement with geotechnical professionals. It provides monitoring and risk awareness but does not replace site investigations, engineering design, geotechnical assessments or professional certification.
LandSure helps geotechnical professionals monitor multiple sites remotely, review long-term movement history, identify trends earlier, support investigations and communicate findings visually.
Yes. Enterprise accounts can provide branded reports, custom dashboards, client portals, automated alerts and data integrations.
Yes. Enterprise users can import GIS layers, shapefiles, CAD information, LiDAR datasets, utility networks, environmental layers and borehole locations into the LandSure platform.
Yes. Enterprise users can overlay stormwater, wastewater, water supply, gas, telecommunications and asset networks alongside satellite intelligence.
Yes. LandSure is designed for councils, planners, developers, infrastructure operators, environmental consultants and engineering firms who require large-scale monitoring and visualisation.
Many New Zealand coastal communities face combined pressures from erosion, rainfall, slope instability, groundwater movement and sea-level rise. Monitoring helps identify changing conditions before visible failures occur.
Yes, for land instability and flood risk. LandSure integrates environmental datasets and monitoring tools that help identify changing patterns associated with flooding, land instability and changing ground conditions. Coastal erosion reporting is not part of our current service - contact us if you need erosion data.
Yes. Historical movement reports can provide visibility into long-term ground behaviour across a property and surrounding area before purchase decisions are made.